1
2
3
4
5
6
7
8
9
10
11
12
13
14
15
16
17
18
19
20
21
22
23
24
25
26
27
28
29
30
31
32
33
34
35
36
37
38
39
40
41
42
43
44
45
46
47
48
49
50
51
52
53
54
55
56
57
58
59
60
61
62
63
64
65
66
67
68
69
70
71
72
73
74
75
76
77
78
79
80
81
82
83
84
85
86
87
88
89
90
91
92
93
94
95
96
97
98
99
100
101
102
103
104
105
106
107
108
109
110
111
112
113
114
115
116
117
118
119
|
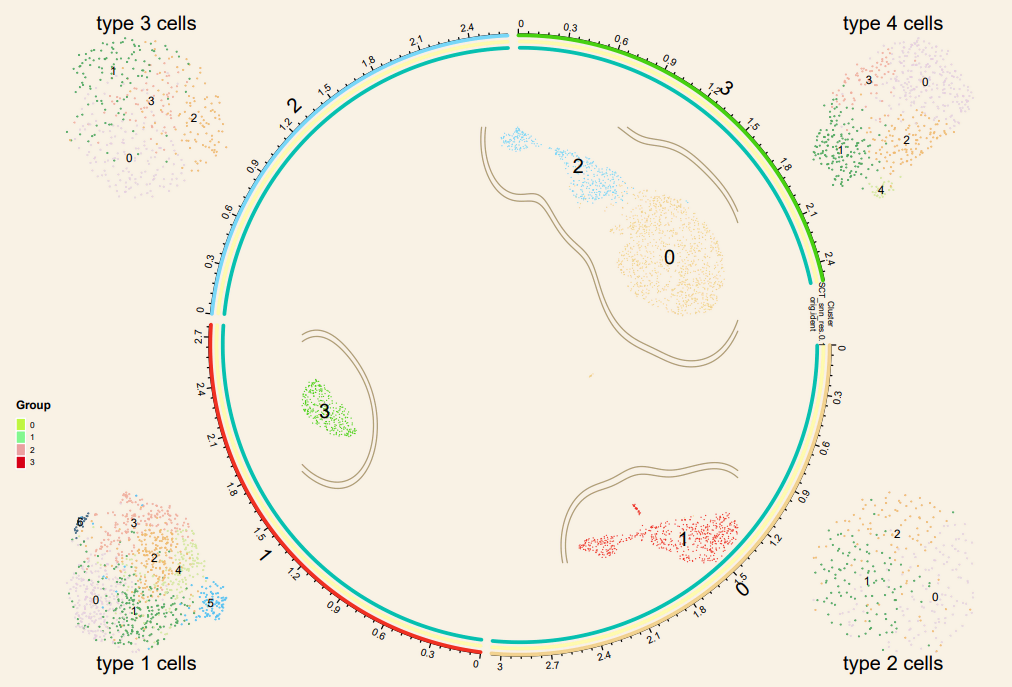
circ_data <- plot1cell::prepare_circlize_data(sce, scale = 0.7)
set.seed(1234)
cluster_colors <- circlize::rand_color(length(levels(sce)))
group_colors <- circlize::rand_color(length(names(table(sce$`SCT_snn_res.0.1`))))
rep_colors <- circlize::rand_color(length(names(table(sce$orig.ident))))
{pdf(file = 'umap_circlize.plot.pdf', width = 9, height = 6)
options(repr.plot.width = 12, repr.plot.height = 8)
plot_circlize_change(circ_data,do.label = T, pt.size = 0.01,
col.use = cluster_colors ,
bg.color = '#F9F2E5',
kde2d.n = 1000,
repel = T,
labels.cex = 1,
circos.cex = 0.5,
label.cex = 1)
plot1cell::add_track(circ_data,
group = "SCT_snn_res.0.1",
colors = group_colors, track_num = 2)
plot1cell::add_track(circ_data,
group = "orig.ident",
colors = rep_colors, track_num = 3)
sub_index = 1
subcolors <- my36colors[1:nlevels(sub.celltype_list[[sub_index]])]
sub_1_meta<-get_metadata(sub.celltype_list[[sub_index]], color = subcolors)
sub_1_meta %>%
dplyr::group_by(seurat_clusters) %>%
summarize(x = median(x = x),y = median(x = y)) -> centers_1
points(sub_1_meta$x*0.32-1.2,sub_1_meta$y*0.32-0.73, pch = 19, col = alpha(sub_1_meta$Colors,0.9), cex = 0.1);
text(centers_1$x*0.32-1.2,centers_1$y*0.32-0.73, labels=centers_1$seurat_clusters, cex = 0.6, col = 'black')
sub_index = 2
subcolors <- my36colors[1:nlevels(sub.celltype_list[[sub_index]])]
sub_1_meta<-get_metadata(sub.celltype_list[[sub_index]], color = subcolors)
sub_1_meta %>%
dplyr::group_by(seurat_clusters) %>%
summarize(x = median(x = x),y = median(x = y)) -> centers_1
points(sub_1_meta$x*0.32+1.2,sub_1_meta$y*0.32+0.73, pch = 19, col = alpha(sub_1_meta$Colors,0.9), cex = 0.1);
text(centers_1$x*0.32+1.2,centers_1$y*0.32+0.73, labels=centers_1$seurat_clusters, cex = 0.6, col = 'black')
sub_index = 3
subcolors <- my36colors[1:nlevels(sub.celltype_list[[sub_index]])]
sub_1_meta<-get_metadata(sub.celltype_list[[sub_index]], color = subcolors)
sub_1_meta %>%
dplyr::group_by(seurat_clusters) %>%
summarize(x = median(x = x),y = median(x = y)) -> centers_1
points(sub_1_meta$x*0.32-1.2,sub_1_meta$y*0.32+0.73, pch = 19, col = alpha(sub_1_meta$Colors,0.9), cex = 0.1);
text(centers_1$x*0.32-1.2,centers_1$y*0.32+0.73, labels=centers_1$seurat_clusters, cex = 0.6, col = 'black')
sub_index = 4
subcolors <- my36colors[1:nlevels(sub.celltype_list[[sub_index]])]
sub_1_meta<-get_metadata(sub.celltype_list[[sub_index]], color = subcolors)
sub_1_meta %>%
dplyr::group_by(seurat_clusters) %>%
summarize(x = median(x = x),y = median(x = y)) -> centers_1
points(sub_1_meta$x*0.32+1.2,sub_1_meta$y*0.32-0.73, pch = 19, col = alpha(sub_1_meta$Colors,0.9), cex = 0.1);
text(centers_1$x*0.32+1.2,centers_1$y*0.32-0.73, labels=centers_1$seurat_clusters, cex = 0.6, col = 'black')
title_text <- function(x0, y0, x1, y1, text, rectArgs = NULL, textArgs = NULL) {
center <- c(mean(c(x0, x1)), mean(c(y0, y1)))
do.call('rect', c(list(xleft = x0, ybottom = y0, xright = x1, ytop = y1), rectArgs))
do.call('text', c(list(x = center[1], y = center[2], labels = text), textArgs))
}
title_text(x0 = -1.35, x1 = -1.05, y0 = -1.06, y1=-1, text = 'type 1 cells',
rectArgs = list(border='#F9F2E4',lwd=0.5),
textArgs = list(col='black',cex = 1))
title_text(x0 = 1.05, x1 = 1.35, y0 = -1.06, y1=-1, text = 'type 2 cells',
rectArgs = list(border='#F9F2E4',lwd=0.5),
textArgs = list(col='black',cex = 1))
title_text(x0 = -1.35, x1 = -1.05, y0 = 1.06, y1=1, text = 'type 3 cells',
rectArgs = list(border='#F9F2E4',lwd=0.5),
textArgs = list(col='black',cex = 1))
title_text(x0 = 1.05, x1 = 1.35, y0 = 1.06, y1=1, text = 'type 4 cells',
rectArgs = list(border='#F9F2E4',lwd=0.5),
textArgs = list(col='black',cex = 1))
Idents(sce) <- "SCT_snn_res.0.1"
col_use <- my36colors[1:nlevels(sce)]
cc <- get_metadata(sce, color = col_use)
cc %>%
dplyr::group_by("SCT_snn_res.0.1") %>%
summarize(x = median(x = x),y = median(x = y)) -> centers
col_group <- c('#bff542','#83f78f','#EBA1A2','#D70016')
lgd_points = Legend(labels = names(table(cc$`SCT_snn_res.0.1`)), type = "points",
title_position = "topleft",
title = "Group",
title_gp = gpar(col='black',fontsize = 7, fontface='bold'),
legend_gp = gpar(col = col_group),
labels_gp = gpar(col='black',fontsize = 5),
grid_height = unit(2, "mm"),
grid_width = unit(2, "mm"),
background = col_group)
draw(lgd_points, x = unit(15, "mm"), y = unit(50, "mm"),
just = c("right", "bottom"))
dev.off()}
|

