2022-10-01-【迁移】使用metacell进行分群聚类.md 7.9 KB
title: 【迁移】使用metacell进行分群聚类 urlname: shi-yong-metacell-jin-hang-fen-qun-ju-lei date: 2022-10-01 17:42:22
tags: metacell
预处理
f_QC_plot <- function(sce){
    options(repr.plot.width = 12, repr.plot.height = 6)
    print(Seurat::VlnPlot(sce, features = c("nFeature_RNA", "nCount_RNA", "percent.mt"), ncol = 3))
    plot1 <- Seurat::FeatureScatter(sce, feature1 = "nCount_RNA", feature2 = "percent.mt")
    plot2 <- Seurat::FeatureScatter(sce, feature1 = "nCount_RNA", feature2 = "nFeature_RNA")
    plot1 + plot2
}
f_read10x <- function(sce, project='sce'){
    sce <- Seurat::CreateSeuratObject(sce, project = project,
                            min.cells = 3, min.features = 200)

    sce[["percent.mt"]] <- Seurat::PercentageFeatureSet(sce, pattern = "^MT-")
    sce[["percent.rp"]] <- Seurat::PercentageFeatureSet(sce, pattern = "^RP[SL]")
    sce <- subset(sce, nFeature_RNA >= quantile(nFeature_RNA, 0.025)
                  & nFeature_RNA <= quantile(nFeature_RNA, 0.975)
                  & nCount_RNA >= quantile(nCount_RNA, 0.025)
                  & nCount_RNA <= quantile(nCount_RNA, 0.975)
                  & percent.mt <= quantile(percent.mt, 0.975))
    sce <- Seurat::NormalizeData(sce)
    g2m_genes <- Seurat::CaseMatch(search=Seurat::cc.genes$g2m.genes,
                                   match=rownames(sce))
    s_genes <- Seurat::CaseMatch(search=Seurat::cc.genes$s.genes,
                                 match=rownames(sce))
    sce <- Seurat::CellCycleScoring(sce, g2m.features=g2m_genes, s.features=s_genes)
    sce$CC.Difference <- sce$S.Score - sce$G2M.Score
    sce <- sce[!grepl(pattern = "(^MT-^RP[SL])",x = rownames(sce)),]
    sce <- Seurat::SCTransform(sce, vst.flavor = "v2",
                           vars.to.regress = c("CC.Difference", "percent.mt", "percent.rp"),
                           verbose = F)
    sce
}
sce <- Seurat::Read10X('filtered_feature_bc_matrix')
sce <- f_read10x(sce, project = 'SRX8890106')
安装补充包
- conda activate seurat
- ~/dev/xray/xray -c ~/etc/xui2.json &
- wget -e "https_proxy=http://127.0.0.1:20809" https://github.com/tanaylab/metacell/archive/refs/heads/master.zip -O metacell-master.zip
- devtools::install_local('metacell-master.zip')
- conda install -c bioconda bioconductor-singlecellexperiment -y
seurat转metacell
###### 构建metacell对象
## 初始化
# 设置存放数据的目录
if(!dir.exists("scdb")){dir.create("scdb")}
metacell::scdb_init("scdb", force_reinit=T)
# 设置存放图形的目录
if(!dir.exists("figs")){dir.create("figs")}
metacell::scfigs_init("figs")
## 提取高变基因
var.genes <- Seurat::VariableFeatures(sce)
var.genes <- structure(rep(1:length(var.genes)), names=var.genes)
var.genes <- metacell::gset_new_gset(sets = var.genes, desc = "seurat variable genes")
metacell::scdb_add_gset("SRX8890106", var.genes)
## 提取counts矩阵
mat <- Seurat::as.SingleCellExperiment(sce)
mat <- metacell::scm_import_sce_to_mat(mat)
metacell::scdb_add_mat("SRX8890106", mat)
聚类MetaCell
## 构建平衡KNN图
metacell::mcell_add_cgraph_from_mat_bknn(mat_id = "SRX8890106",
                               gset_id = "SRX8890106",
                               graph_id = "SRX8890106_k100",
                               K = 100,
                               dsamp = F)  # 20,000 cells之内不必抽样
## 共聚类
metacell::mcell_coclust_from_graph_resamp(coc_id = "SRX8890106_n1000", graph_id = "SRX8890106_k100",
                                min_mc_size = 20,  p_resamp = 0.75, n_resamp=1000)
## 生成初级metacell
metacell::mcell_mc_from_coclust_balanced(coc_id = "SRX8890106_n1000", mat_id = "SRX8890106", mc_id = "SRX8890106",
                               K = 20, min_mc_size = 20, alpha = 2)
## 修剪metacell
metacell::mcell_plot_outlier_heatmap(mc_id = "SRX8890106", mat_id = "SRX8890106", T_lfc = 3)
metacell::mcell_mc_split_filt(new_mc_id = "SRX8890106", mc_id = "SRX8890106", mat_id = "SRX8890106", T_lfc = 3, plot_mats = T)
## 2D图展示Cells与MCs
metacell::mc_colorize_default('SRX8890106')
metacell::mcell_mc2d_force_knn(mc2d_id="SRX8890106", mc_id="SRX8890106", graph_id="SRX8890106_k100")
tgconfig::set_param("mcell_mc2d_height", 1000, "metacell")
tgconfig::set_param("mcell_mc2d_width", 1000, "metacell")
metacell::mcell_mc2d_plot(mc2d_id = "SRX8890106")
导出MetaCell到seurat
mc <- metacell::scdb_mc('SRX8890106')
sce$metacell <- 0
sce$metacell[names(mc@mc)] <- mc@mc
saveRDS(sce@meta.data, 'SRX8890106_meta.rds')
确定最佳分群
读入之前使用metacell进行分群聚类中的数据
f_getBestPcs <- function(stdev){
    # Determine percent of variation associated with each PC
    pct <- stdev / sum(stdev) * 100
    # Calculate cumulative percents for each PC
    cumu <- cumsum(pct)
    # Determine which PC exhibits cumulative percent greater than 90% and % variation associated with the PC as less than 5
    co1 <- which(cumu > 90 & pct < 5)[1]
    co1
    # Determine the difference between variation of PC and subsequent PC
    co2 <- sort(which((pct[1:length(pct) - 1] - pct[2:length(pct)]) > 0.1), decreasing = T)[1] + 1
    # Minimum of the two calculation
    pcs <- min(co1, co2)
    pcs
}
f_plotBestClusters <- function(sce){
    sce <- Seurat::FindClusters(
        object = sce,
        resolution = c(seq(.1,1.6,.1)) #起始粒度,结束粒度,间隔
    )
    options(repr.plot.width = 12, repr.plot.height = 16)
    require(clustree)
    clustree::clustree(sce@meta.data, prefix = "SCT_snn_res.")
}
sce <- readRDS('SRX8890106.rds')
sce@meta.data <- readRDS('SRX8890106_meta.rds')
sce <- Seurat::RunPCA(sce, assay="SCT", verbose = FALSE)
pcs <- f_getBestPcs(sce [["pca"]]@stdev)
sce <- Seurat::FindNeighbors(sce, reduction = "pca",
                             dims = 1:pcs, verbose = FALSE)
f_plotBestClusters(sce)
进行分群
sce <- Seurat::FindClusters(
    object = sce,
    resolution = 1.3 #读图得到最佳分辨率
)
sce <- Seurat::RenameIdents(sce,
                            '6'='6',
                            '12'='6',
                            '16'='6',
                            '2'='6',
                            '5'='6'
                           )
sce <- Seurat::RenameIdents(sce,
                            '0'='0',
                            '1'='0',
                            '9'='0'
                           )
table(Seurat::Idents(sce))
标注Doublet
读表获取先验的Doublet占比
f_Doublet_get_pK <- function(sce, pcs){
    sweep.res <- DoubletFinder::paramSweep_v3(sce, PCs = 1:pcs, sct = T, num.cores=4)
    sweep.stats <- DoubletFinder::summarizeSweep(sweep.res, GT = FALSE)
    bcmvn <- DoubletFinder::find.pK(sweep.stats)
    pK_bcmvn <- as.numeric(as.character(bcmvn$pK[which.max(bcmvn$BCmetric)]))
    pK_bcmvn
}
f_DoubletFinder <- function(sce, pcs, pK_bcmvn, DoubletRate, seurat_clusters){
    homotypic.prop <- DoubletFinder::modelHomotypic(seurat_clusters)   # 最好提供celltype
    nExp_poi <- round(DoubletRate*length(seurat_clusters))
    nExp_poi.adj <- round(nExp_poi*(1-homotypic.prop))
    sce <- DoubletFinder::doubletFinder_v3(sce, PCs = 1:pcs,
                                           pN = 0.25, pK = pK_bcmvn,
                                           nExp = nExp_poi.adj, reuse.pANN = FALSE,
                                           sct = T)
    sce
}
pK_bcmvn <- f_Doublet_get_pK(sce, pcs)
sce$seurat_clusters <- Idents(sce)
# ~8000 cells ~6.1% DoubletRate
sce <- f_DoubletFinder(sce, pcs, pK_bcmvn, 0.061, sce$seurat_clusters)
saveRDS(sce@meta.data, 'SRX8890106_meta.rds')
可视化
sce <- Seurat::RunUMAP(sce, reduction = "pca",
                       dims = 1:30, verbose = FALSE)
options(repr.plot.width = 12, repr.plot.height = 6)
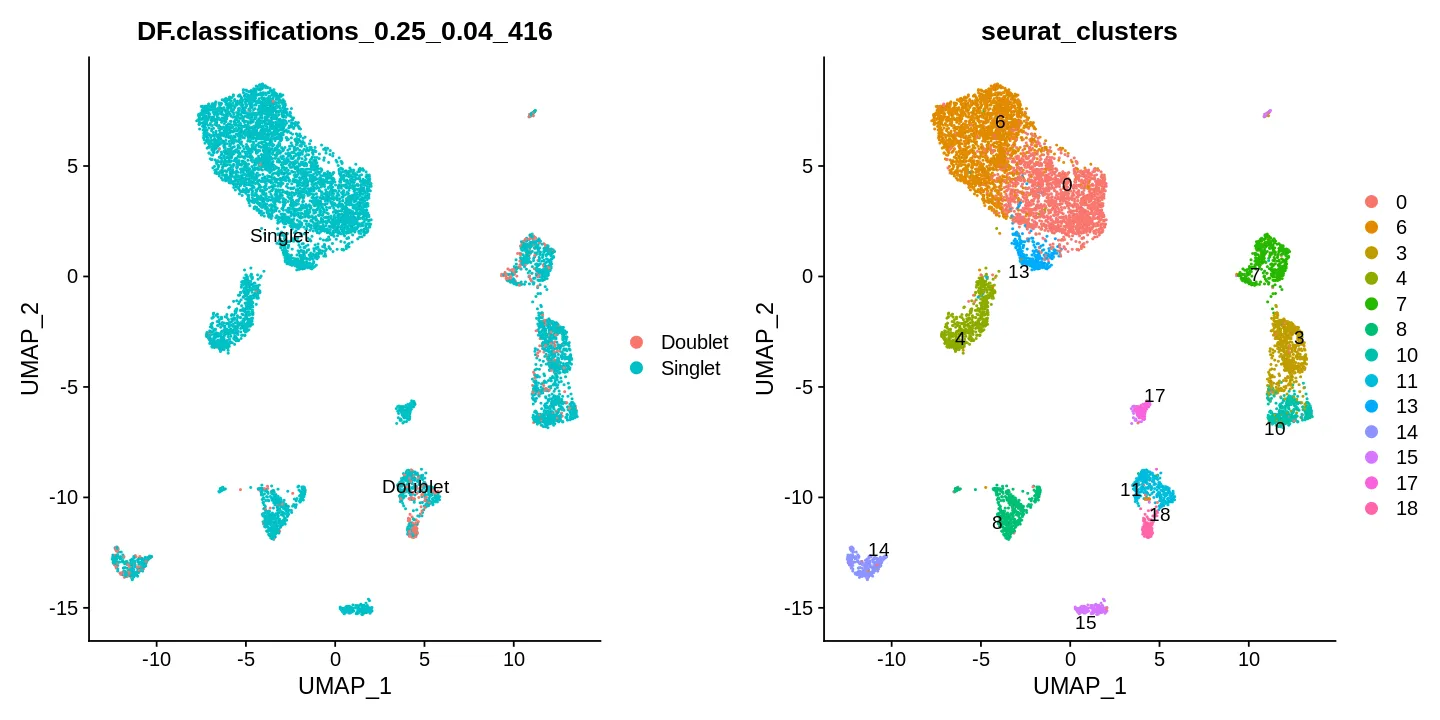
DimPlot(sce, reduction = "umap", label = T, repel = T,
        group.by = c("DF.classifications_0.25_0.04_416", 'seurat_clusters'))
