2022-07-15-【迁移】森林图展示回归分析的结果.md 2.5 KB
title: 【迁移】森林图展示回归分析的结果 urlname: Forest-plot-displays-the-results-of-regression-analysis date: 2022-07-15 20:42:25 index_img: https://api.limour.top/randomImg?d=2022-07-15 20:42:25
tags: ['forestplot', 'regression']
配置环境
- 基础编程环境
- GitHub 下载加速
-
conda create -n forestplot -c conda-forge r-forestplot -y
conda activate forestplot
conda install -c conda-forge r-tidyverse r-irkernel -y
Rscript -e "IRkernel::installspec(name='forestplot', displayname='r-forestplot')"
使用示例
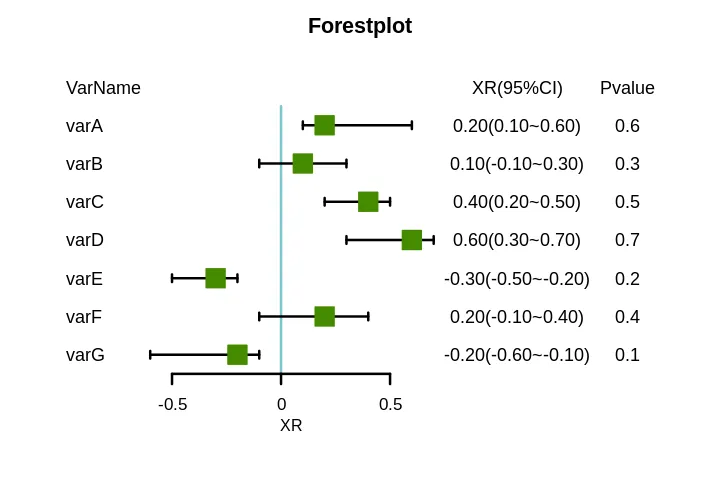
require(forestplot)
f_forestplot <- function(df, xlab="XR", zero=0, lineheight=unit(10,'mm'), colgap=unit(2,'mm'), graphwidth=unit(60,'mm'), title="Forestplot"){
df_labeltext <- df[,c('VarName', 'Pvalue')]
df_labeltext[[paste0(xlab,'(95%CI)')]] <- paste0(sprintf("%0.2f", df$mean),'(',sprintf("%0.2f", df$lower),'~',sprintf("%0.2f", df$upper),')')
df_labeltext[['Pvalue']] <- sprintf('%0.1e', df_labeltext[['Pvalue']])
df_labeltext <- rbind(colnames(df_labeltext), df_labeltext)
df <- rbind(rep(NaN, ncol(df)), df)
forestplot(labeltext=as.matrix(df_labeltext[,c(1,3,2)]),
           mean=df$mean,
           lower=df$lower,
           upper=df$upper,
           zero=zero,
           boxsize=0.5,
           lineheight=lineheight,
           colgap=colgap,
           graphwidth=graphwidth,
           lwd.zero=2,
           lwd.ci=2,
           col=fpColors(box='#458B00',
                        summary='#8B008B',
                        lines = 'black',
                        zero = '#7AC5CD'),
           xlab=xlab,
           lwd.xaxis =2,
           txt_gp = fpTxtGp(ticks = gpar(cex = 0.85),
                            xlab  = gpar(cex = 0.8),
                            cex = 0.9),
           lty.ci="solid",
           title=title,
           line.margin = 1,
           graph.pos=2)
}
df <- data.frame( 'VarName' = c('varA', 'varB', 'varC', 'varD', 'varE', 'varF', 'varG'), 'mean' = c(0.2, 0.1, 0.4, 0.6, -0.3, 0.2, -0.2), 'lower' = c(0.1, -0.1, 0.2, 0.3, -0.5, -0.1, -0.6), 'upper' = c(0.6, 0.3, 0.5, 0.7, -0.2, 0.4, -0.1), 'Pvalue' = c(0.6, 0.3, 0.5, 0.7, 0.2, 0.4, 0.1) ) options(repr.plot.width=6, repr.plot.height=4) f_forestplot(df)